
State and Local Government Finance Outlook – Census of Governments
The U.S. Census Bureau Report on State and Local Government Finances provides information on the structure, function, finances, and employment of over 90,000 state and local governments.
 The report uses data on state and local government finances based on information collected from the 2007 and 2012 Census of Governments: Finance—Surveys
of State and Local Government Finances.
From 2007 to 2012, two major contributors to the decline in total revenues for state and local governments were employee retirement revenue, dropping 67.7 percent, from $533.3 billion to $172.0 billion, and interest earnings, falling 44.6 percent, from $91.9 billion to $50.9 billion.
Individual income tax revenues for state and local governments rose 5.9 percent from $290.3 billion in 2007 to $307.3 billion in 2012, while corporate income tax revenue fell 19.6 percent from $61.0 billion to $49.0 billion from 2007 to 2012.
State and local government capital spending on education declined 7.9 percent, from $91.7 billion in 2007 to $84.5 billion in 2012; elementary and secondary education capital spending largely contributed to this decline, falling from $65.5 billion to $51.1 billion from 2007 to 2012.
Unemployment compensation expenses more than tripled, from $28.9 billion to $95.6 billion from
2007 to 2012.
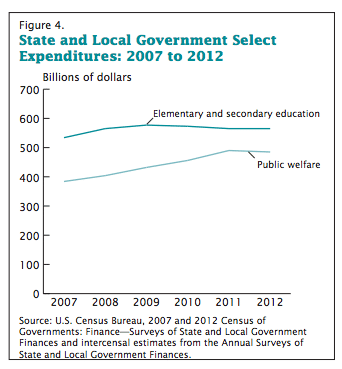
Public welfare spending for state and local governments rose from $384.6 billion in 2007 to $485.6 billion in 2012, or 26.2 percent.
Note: The general government sector includes all government revenue and expenditure activities that are consistent with government functions, such as public safety, education, health, and welfare.
State and local government revenues decreased 1.1 percent, from $3.1 trillion in 2007 to $3.0 trillion in 2012. The decrease was driven in part by insurance trust revenue, which decreased
53.8 percent in 2012, from $596.7 billion, in 2007, to $275.4 billion.
- Expenditures increased 18.2 percent to $3.2 trillion for state and local governments from 2007 to 2012. Education and public welfare comprised 43.0 percent of total state and local government expenditures, accounting for 27.6 percent and 15.4 percent, respectively.
- During the same time period, state and local government indebtedness increased 22.2 percent, from $2.4 trillion to $2.9 trillion, with local governments accounting for 61.1 percent of the total amount of state and local government debt outstanding.
- Cash and security holdings of state and local governments declined 1.7 percent to $5.3 trillion in 2012, with state governments accounting for 69.8 percent of the total and local governments accounting for the remainder. Public-employee retirement trust funds comprised the largest source of cash and security holdings at $2.9 trillion.
Learn more about State and Local Government Finance Jobs for city, county and state agencies.