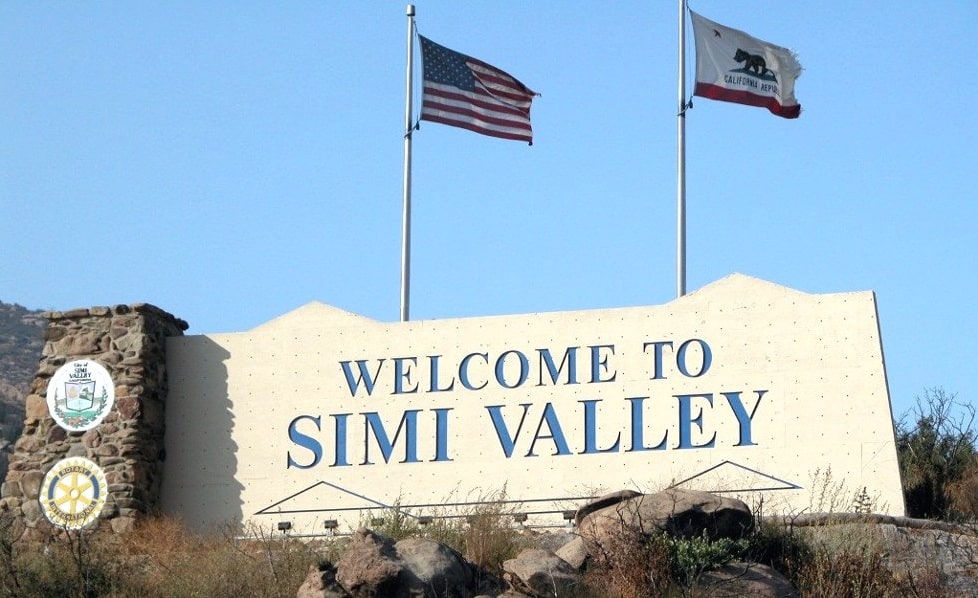
Featured Client: City of Simi Valley
The City of Simi Valley, with an estimated population of 126,414 (as of December 2011) is the third largest of Ventura County’s ten cities. Occupying an area of approximately 42 square miles, it is located in Southeast Ventura County, adjacent to the northwestern perimeter of the San Fernando Valley, approximately 37 miles northwest of downtown Los Angeles. The City was incorporated in 1969 under the general laws of the State of California and operates under a General-Law/council-manager form of government.
Demographics
| People QuickFacts | Simi Valley | California |
| Population, 2012 estimate | 125,793 | 37,999,878 |
| Population, 2010 (April 1) estimates base | 124,239 | 37,253,959 |
| Population, % change, 4/1/10 to 7/1/12 | 1.3% | 2.0% |
| Population, 2010 | 124,237 | 37,253,956 |
| Persons <5 years, 2010 | 6.1% | 6.8% |
| Persons <18 years, 2010 | 25.0% | 25.0% |
| Persons 65 years and over, 2010 | 10.6% | 11.4% |
| Female persons, 2010 | 50.9% | 50.3% |
| White alone, percent, 2010 (a) | 75.3% | 57.6% |
| Black or African American alone, 2010 (a) | 1.4% | 6.2% |
| American Indian and Alaska Native alone, 2010 (a) | 0.6% | 1.0% |
| Asian alone, percent, 2010 (a) | 9.3% | 13.0% |
| Native Hawaiian and Other Pacific Islander alone, 2010 (a) | 0.1% | 0.4% |
| Two or More Races, 2010 | 4.6% | 4.9% |
| Hispanic or Latino, 2010 (b) | 23.3% | 37.6% |
| White alone, not Hispanic or Latino, 2010 | 62.8% | 40.1% |
| Living in same house 1 year & over, 2008-2012 | 88.2% | 84.2% |
| Foreign born persons, 2008-2012 | 19.7% | 27.1% |
| Language other than English spoken at home, pct age 5+, 2008-2012 | 27.1% | 43.5% |
| High school graduate or higher, percent of persons age 25+, 2008-2012 | 90.2% | 81.0% |
| Bachelor’s degree or higher, percent of persons age 25+, 2008-2012 | 32.1% | 30.5% |
| Veterans, 2008-2012 | 7,007 | 1,952,910 |
| Mean travel time to work (minutes), workers age 16+, 2008-2012 | 29.4 | 27.1 |
| Housing units, 2010 | 42,506 | 13,680,081 |
| Homeownership rate, 2008-2012 | 74.2% | 56.0% |
| Housing units in multi-unit structures, 2008-2012 | 17.4% | 30.9% |
| Median value of owner-occupied housing units, 2008-2012 | $448,500 | $383,900 |
| Households, 2008-2012 | 41,186 | 12,466,331 |
| Persons per household, 2008-2012 | 2.99 | 2.93 |
| Per capita money income in past 12 months (2012 dollars), 2008-2012 | $35,769 | $29,551 |
| Median household income, 2008-2012 | $87,894 | $61,400 |
| Persons below poverty level, percent, 2008-2012 | 6.6% | 15.3% |
| Business QuickFacts | Simi Valley | California |
| Total number of firms, 2007 | 13,188 | 3,425,510 |
| Black-owned firms, percent, 2007 | S | 4.0% |
| American Indian- and Alaska Native-owned firms, 2007 | S | 1.3% |
| Asian-owned firms, percent, 2007 | 7.8% | 14.9% |
| Native Hawaiian and Other Pacific Islander-owned firms, 2007 | S | 0.3% |
| Hispanic-owned firms, 2007 | 13.3% | 16.5% |
| Women-owned firms, 2007 | 26.2% | 30.3% |
| Manufacturers shipments, 2007 ($1000) | 831,588 | 491,372,092 |
| Merchant wholesaler sales, 2007 ($1000) | 852,462 | 598,456,486 |
| Retail sales, 2007 ($1000) | 1,689,617 | 455,032,270 |
| Retail sales per capita, 2007 | $14,155 | $12,561 |
| Accommodation and food services sales, 2007 ($1000) | 204,850 | 80,852,787 |
| Geography QuickFacts | Simi Valley | California |
| Land area in square miles, 2010 | 41.48 | 155,779.22 |
| Persons per square mile, 2010 | 2,995.1 | 239.1 |
| FIPS Code | 72016 | 6 |
| Counties | Ventura County | |
| (a) Includes persons reporting only one race. | ||
| (b) Hispanics may be of any race, so also are included in applicable race categories. | ||
| FN: Footnote on this item for this area in place of data | ||
| NA: Not available | ||
| D: Suppressed to avoid disclosure of confidential information | ||
| X: Not applicable | ||
| S: Suppressed; does not meet publication standards | ||
| Z: Value greater than zero but less than half unit of measure shown | ||
| F: Fewer than 100 firms | ||
| Source: US Census Bureau State & County QuickFacts | ||